Table of Contents
This document is tailored towards developers intending to test the Engineering Diffraction interface. Whilst users may benefit from the additional documentation provided in this document it is recommended they read Engineering Diffraction instead which is tailored towards users.
The files used in the following examples are found within System test files within <MantidBuildDir>/ExternalData/Testing/Data/SystemTest after building the SystemTestData target.
The Engineering Diffraction interface allows scientists using the EnginX instrument to interactively process their data. There are 5 tabs from which are ordered according to the main steps performed. These are:
The first time the interface is opened it will be disabled except for the RB number entry box and a pop up box which should prompt for a RB number. For testing purposes this can be anything.
If a vanadium calibration has never been run the Current calibration will be empty. Once a calibration has been run these fields will retain their values for future runs of the program. The following files can be used for the calibration run.
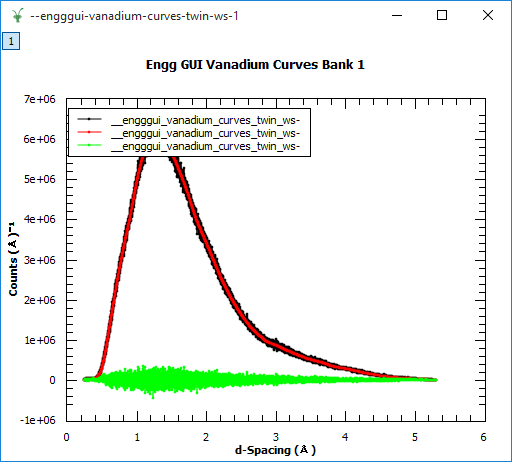
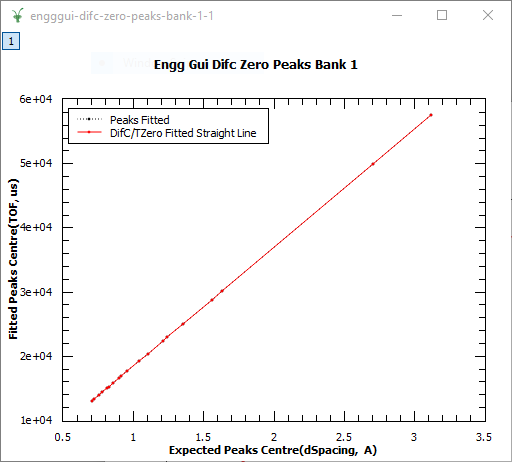
Once the calibration has completed if the calibration was successful plotting the spectra of the newly created workspaces will produce images similar to below:


If the plot is incorrect check you haven’t swapped the run numbers and they are both correct.
If Current calibration is populated the algorithm will attempt to use a cached calculation instead of recalculating the calibration. To force it to recalculate every time for testing purposes the option can be set under Settings .
A cropped calibration can be used to limit the spectra considered during calibration. This can be useful if a subset of detectors are going to be used.
Focusing takes a workspace with histogram data and sums the spectra into a single spectrum. If the data is captured in event mode (i.e.. Event workspaces) it will first need Pre-processing .
A .nxs file containing histogram data needs to be selected for example ENGINX00193749.nxs this can have all banks summed, specific spectra and list or use a detector grouping to create a texture.
Once the focus run has finished it will save a focused .nxs file in
C:\EnginX_Mantid\User\<RB Number> or ~/EnginX_Mantid/User/<RB Number>
and store a copy in C:\EnginX_Mantid\Focus or ~/EnginX_Mantid/Focus.
The saved focused .nxs filename will be of the format <INST>_<Run number>_focused_bank_<bank number>.nxs
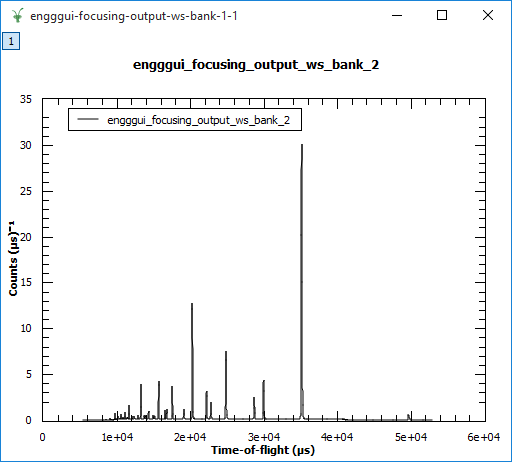
Plotting the focused workspace should look similar to the image below:

Pre-processing is used to convert event data into histogram data which can be subsequently focused. The optimal parameters for pre-processing are dependent on how the instrument was configured during the capture of the data.
Regular time binning requires the bin width to be specified and will produce a histogram # workspace with TOF as the X axis.
If the multi-period data with pulse times is captured Multi-period data should be used instead with the delta in time on every step of the X axis entered.
For testing purposes with regular time binning testing should be done using a .s0 file such as 299735.s08, multi-period data should instead use a run from 285643-285701 which are event workspaces.
Fitting allows a user to plot the peaks from their focused nexus file obtained from Focus . The focused run can be entered by value 193749, a range of runs 19000-19100 or by browsing for the focused file.
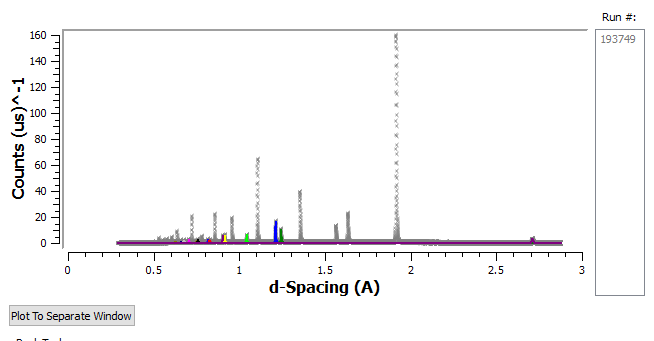
After the fitting has run if it managed to fit any peaks it should look similar to below if there are no peaks and the display looks “corrupted” check the calibration was completed correctly:

The banks available to plot are selected with the Plot Bank selector and then fit is clicked. Mantid will plot the peaks in the peak picker window, expected peaks can also be selected to help the fitting process. Zoom in by dragging with the LMB and out by clicking the RMB. Peaks are selected by holding Shift whilst clicking the LMB on a peak similar to the fit interface.
Once peaks are selected fit can be re-run with the expected peak list specified to attempt to create a better fitting.
GSAS-style fitting allows the user to plot peaks from their focused NeXuS file (obtained from Focus).
After a fit has run, the plot should look something like below:

If that fit output (the red line) is flat, or just follows the background of the data, the fit was not unsuccessful. Make sure you’re using the right .cif and .prm files for your run. You can find an example of files which work nicely together on most PRs related to the GSAS tab or GSASIIRefineFitPeaks, or have a look here.
Warning
At the moment, you will also just get background if you try to do a Pawley refinement, as this is still under development, possibly requiring input from ENGINX scientists or GSAS-II developers (probably both)
You can navigate around the plot in the same way as the Fitting tab.
Used as additional search locations when only a run number is specified such as 193749. These do not need to be set for the browse (full paths) to work.
Is used for a full calibration run. Before each run they perform a quick calibration which is accounted for in the Calibration tab. Every couple of years they perform a long calibration which is then processed and used as a baseline which is set here.
Useful whilst troubleshooting calibrations if you think a cached calibration is incorrect or you are testing the calibration algorithm. However this incurs a significant speed penalty as calibration is run every time instead of just reusing the results.
Allows the user to specify the output directory of their own focused runs it defaults to C:\EnginX_Mantid\Focus or ~/EnginX_Mantid/Focus but can be changed to suit the users needs.
Categories: Interfaces | Diffraction